Modeling the Tsunami of 14 November 2016 in New Zealand
IRIDeS, Tohoku University, Tsunami engineering laboratory
Summary
- On November 14, 2016 (local time at New Zealand), a M7.8 earthquake and its series occurred at the South Island of New Zealand and triggered tsunami waves of 2.49 meters at Kaikoura Coast (recorded tsunami height as the tidal wave data by PTWC), followed by 1.47 m wave at the same place, 0.43 m wave at Wellington, and 0.12 m wave at Castlepoint, respectively.
This page will be updated from time to time with relevant information.
About Earthquakes
Main shock
- Magnitude : 7.8
- Location (lat, lon) : ( -42.757, 173.077 )
- Depth : 23.0 km
- Origin Time : 2016-11-13 11:02:56.970 UTC
- Source: USGS
Aftershock (2nd biggest)
- Magnitude : 6.5
- Location (lat, lon) : ( -42.254, 173.630 )
- Depth : 10.0 km
- Origin Time : 2016-11-13 11:32:07.310 UTC
- Source: USGS
Aftershock (2nd biggest)
- Magnitude : 6.5
- Location (lat, lon) : ( -42.586, 173.284 )
- Depth : 10.0 km
- Origin Time : 2016-11-14 00:34:22.530 UTC
- Source: USGS
Distribution of aftershocks (Some figures are added by Tohoku University)
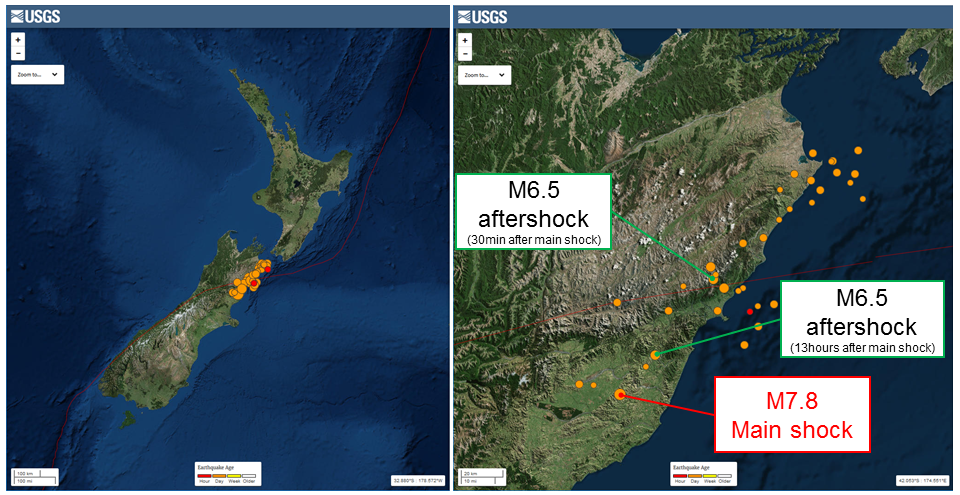
Source: USGS
Information at New Zealand
Tsunami Wave Observation
- The earthquakes triggered tsunami waves of 2.49 meters at Kaikoura Coast (recorded tsunami height as the tidal wave data by PTWC), followed by 1.47 m wave at the same place, 0.43 m wave at Wellington, and 0.12 m wave at Castlepoint, respectively. The graphs show the de-tied tsunami gauge chart (upper graph) and the sea level tsunami gauge chart (lower graph).
Note. The graphs are created by GNS Science (Licensed under a Creative Commons Attribution 3.0 New Zealand License).

Source: GeoNet
Source: PTWC
Source: PTWC
Tsunami Warnings
- MCDEM announced the first tsunami warning at 01:32 NZDT on November 14. The figure shows the warning at 04:03 NZDT which was for 0.2-5.0 meters throughout the country including Chatham Islands. Later, the warning was downgraded to only 0.2-1 meters and covered only at Wellington and the upper eastern coasts of the South Island. All tsunami warnings were canceled at about 15:12 NZDT.
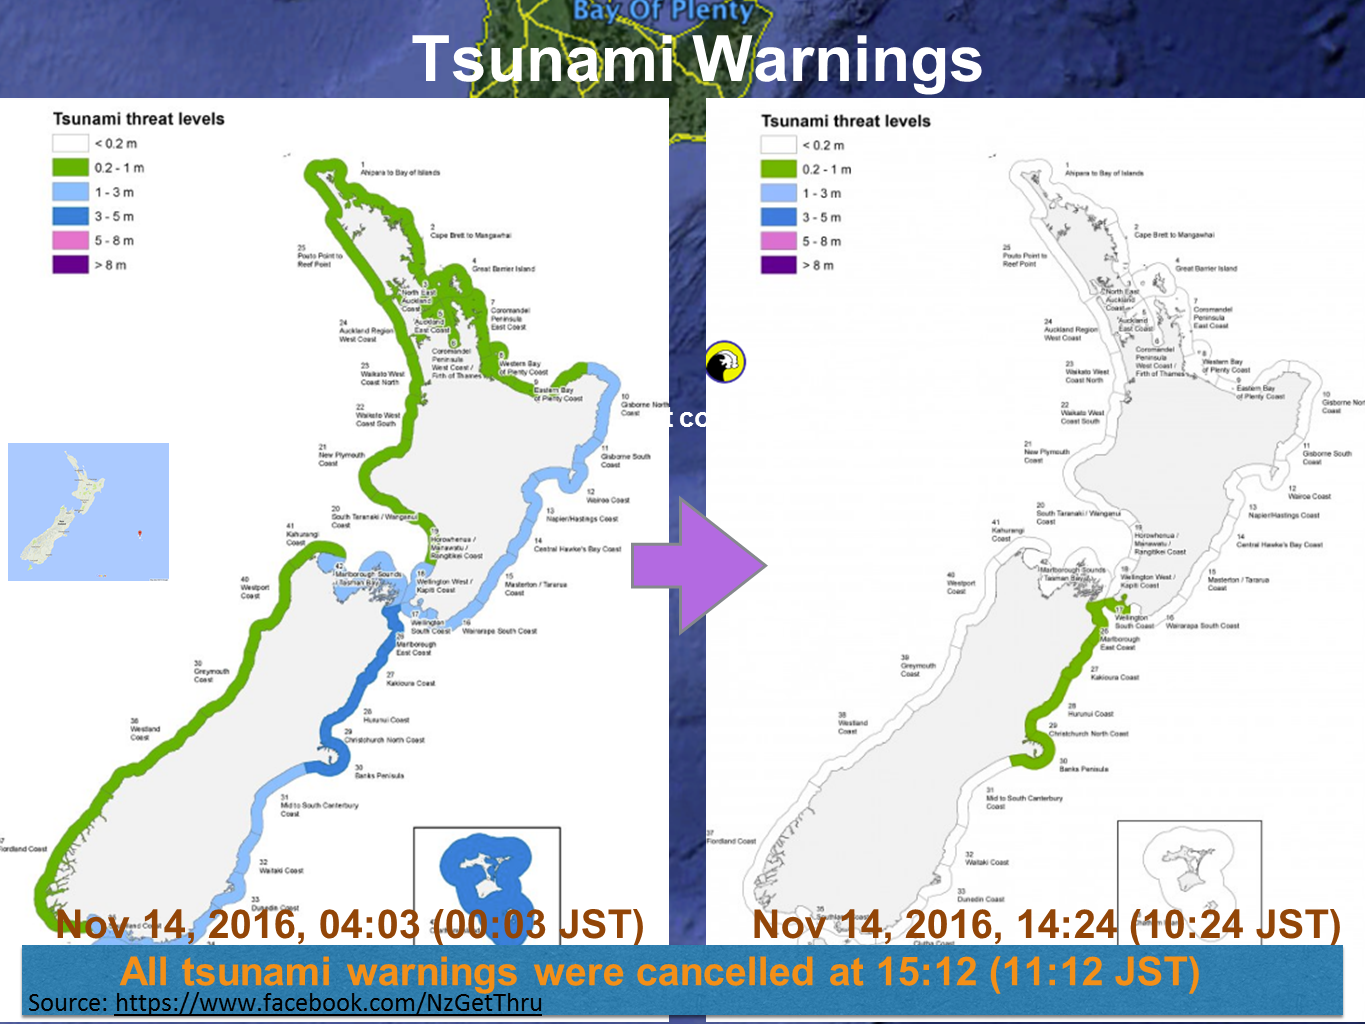
Source: Facebook(Civil Defence)
SNS Use in Disaster Warning Information
- In addition to TV and radio, the SNS has been utilized as one of the channels to provide disaster and warning information to the citizens. New Zealand's Ministry of Civil Defence and Emergency Management (MCDEM) has provided information through their Facebook (NzGetThru) and Twitter (@NZcivildefence).
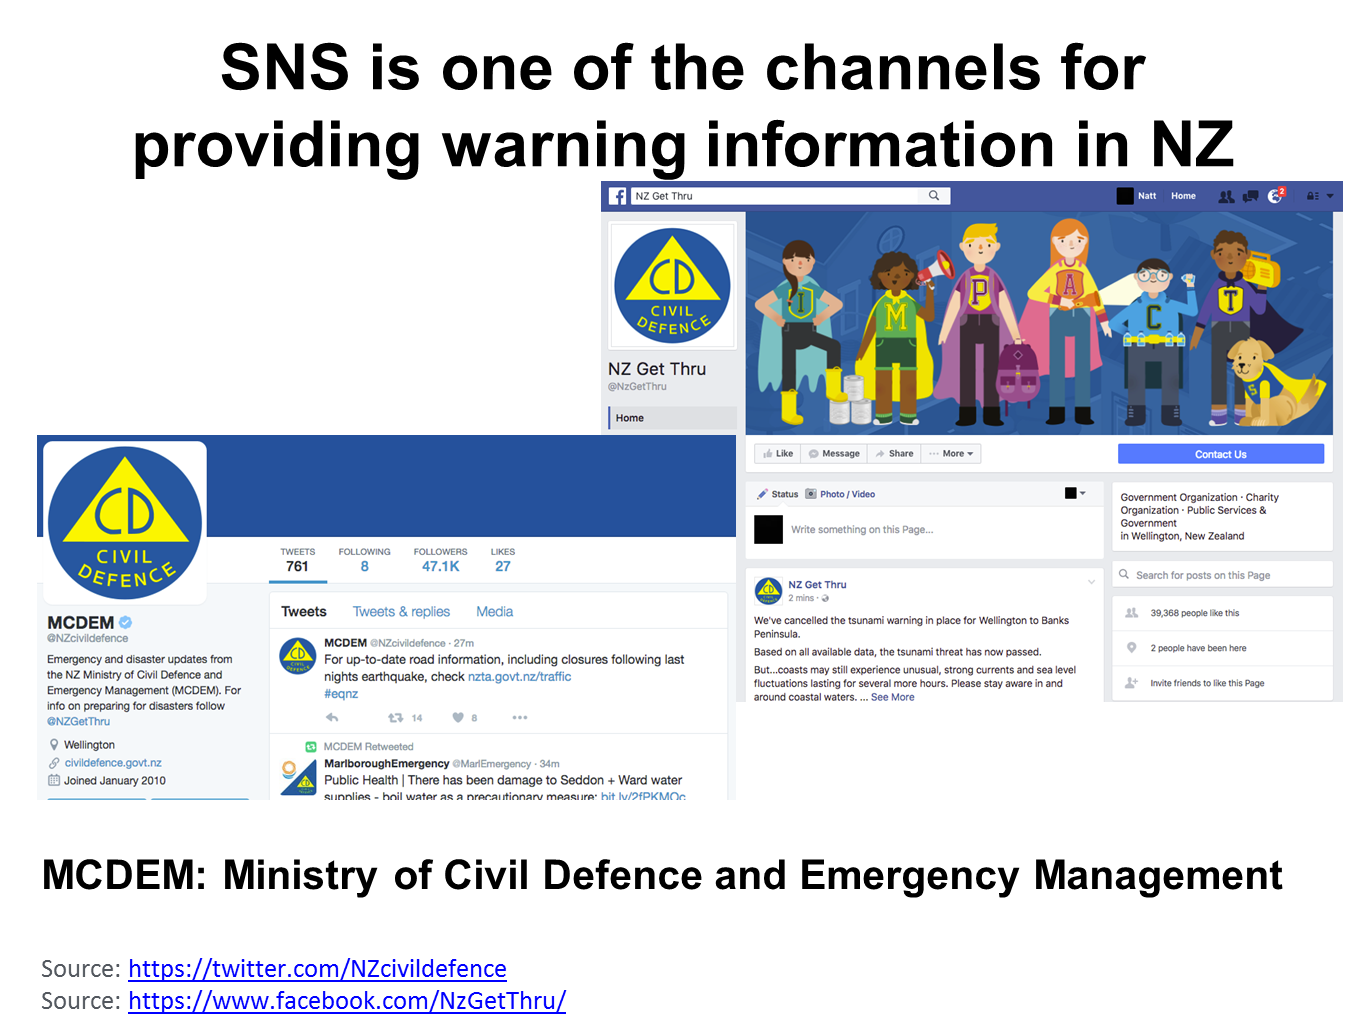
Source: Twitter(Civil Defence)
Source: Facebook(Civil Defence)
If you want PDF file of all figure Click here
Tsunami Propagation Model Calculated by Tsunami Engineering Laboratory (preliminary result)
Source
Movie
Maximum Tsunami Height Distribution
Maximum Tsunami Current Velocity Distribution
Comparision of Tsunami Waveform (Observed and Calculated)
Observation Points
Tsunami Observation
- NOAA/PTWC
- NOAA/NDBC
- NOAA/NGDC
- UNESCO/IOC
News
- ABC
- BBC
- CNN
- NHK (in Japanese)
- Kahoku Shinpo (in Japanese)
- Asahi Shinbun (in Japanese)

by:
F. Imamura, A. Suppasri, N. Leelawat, P. Latcharote, F. Makinoshima, M. Watanabe, H. Ohira, Y. Hirakawa, N. Togawa, N. Hasegawa, T. Otake, R. Baba, K. Fukui
(Tsunami Engineering, Hazard and Risk Evaluation Research Division)
S. Sato
(Disaster Digital Archive, Disaster Information Management and Public Collaboration Division)
K. Yamashita, A. Hayashi, Y. Abe
(Earthquake induced Tsunami Risk Evaluation (Tokio Marine), Endowed Research Division)