1.
Introduction
Tsunamis
generated by earthquakes along the Japanese
coast on the possible boundary between the Eurasian and the North American
plates have caused significant damages to the Japanese and Russian coasts, and damage to the Korean coast as well. For
example, at
noon on the 26th May 1983, a huge earthquake occurred in the northern coast of Akita and the accompanying
tsunami attacked the eastern coast
of Korea, after propagating over the in the Japan (East) Sea. Especially at the Imwon port, the most significant damage; two persons killed
and twenty houses damaged, was reported. In this paper, by the nuemrical simulation with the fine meshed data
in Korea, we
re-examine the tsunami along the southern Korean coast, which was recently reported by NIDP (1999), providing
with the detail damage and tsunami
behavior.
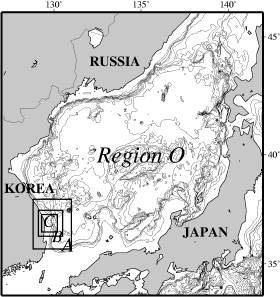
Figure
1. Nested
grid system for the tsunami numerical model in the Japan (East) Sea.
2. Numerical Model
We constructed the nested grid system with the fine resolution bathymetry
data shown in Figure 1 in order to simulate the whole process with generation,
propagation and runup. The sub-regions are
dynamically connected each other with
spatial grid ratio of 1:3. The minimum grid size is 41
m at the Region C shown in Figure 1. Among the several proposed
fault parameters for the 1983 Japan (East) Sea earthquake, the Aida Model-10
(Aida, 1984) is now selected to estimate the tsunami source, since the model is reported as
the best to explain the tsunami heights along the
Japanese coast.
3. Numerical Condition
Next, the governing equation
and final sub-region along the Korean coast should be carefully determined. Now
we assume the two different equations; linear long wave and shallow water
theory, and sub-regions with 123 m and 41 m of spatial grid size. By comparing
the calculated results with the measured, we will fix the best condition for
the numerical model. The four cases with the different conditions are selected
to be compared, shown in Table 1.
Table 1. Numerical conditions
and calculated results of Aida’s mean value and
standard deviation for four cases (相田, 1977).
|
|
Numerical condition |
Mean (K) |
Standard deviation (κ) |
|
Case 1 |
Linear, dx=123m |
1.30 |
1.35 |
|
Case 2 |
Linear, dx=41m |
1.22 |
1.27 |
|
Case 3 |
Non-Linear, dx=123m |
1.34 |
1.40 |
|
Case 4 |
Non-Linear, dx=41m |
1.14 |
1.26 |
4.
Numerical Results and Discussion
Numerical simulations for four cases are carried out and
their results are shown in Figure 2. Although we can understand the
distribution of the calculated tsunami heights, it is difficult to discuss the
reliability for them. The Aida’s
parameter (相田, 1977); geometric mean
value and standard deviation, is introduced to select the best condition for
the model. The result is shown Table 1, suggesting the case 4
is the best of them, most close value of the mean to the unity and the smallest
deviation.
Figure 2.
Comparison between measured tsunami runup heights and calculated tsunami
wave heights along the eastern Korean coast for four cases.
Table
2. Comparison between measured runup heights and calculated wave heights of the 1983 tsunami along the east Korean coast for the case 4.
|
Name of points |
Mea. height (m) |
Cal. height (m) |
log10 (mea./cal.) |
|
Samchuk Port |
2.99 |
1.61 |
0.269 |
|
Geunduk |
3.56 |
2.65 |
0.128 |
|
Namapo |
1.55 |
1.54 |
0.004 |
|
Gungchon Beach |
1.65 |
1.56 |
0.025 |
|
Gungchon |
2.46 |
2.05 |
0.080 |
|
Chogok |
2.36 |
2.52 |
-0.028 |
|
Yongwha Beach |
3.76 |
2.44 |
0.188 |
|
Yongwha Port |
3.99 |
2.02 |
0.296 |
|
Jangho Port |
2.50 |
2.59 |
-0.016 |
|
Galnam Port |
1.42 |
1.55 |
-0.037 |
|
Shinnam Port |
2.67 |
2.44 |
0.039 |
|
Imwon Port |
5.10 |
4.90 |
0.018 |
|
Biwha Port |
2.09 |
2.32 |
-0.046 |
|
NogokPort |
4.00 |
3.98 |
0.002 |
|
Jakjin Port |
4.65 |
4.71 |
-0.005 |
|
Hosan Port |
4.28 |
3.78 |
0.054 |
|
Nagok Port |
2.97 |
2.79 |
0.027 |
Table 2 shows the measured and calculated tsunami heights with the case 4,
in which we can find 4 places with large discrepancies, more than 0.1 of value
log10(measured/calculated); Samchuk port, Geunduk, Yongwha beach and
Yongwha port. One of reasons
for the discrepancy is
the topography and bathymetry data that are more
complicated and complex as to the resolution of 41
m grid size. Figure 3(a) shows the example of geometry and topography at Samchuk where
we see the harbor facility such as break water and sea wall characterizing a
local topography. Another reason is the boundary
condition. We include the runup effect in the model, however the topography on
the land is not enough to express the slope and land-use. Except for 4 places,
we have good agreement with the measured, showing the appropriate models for
the tsunami source and propagation of the 1983 tsunami.
(a) Samchuk (b) Imwon
Figure
3. Measured
tsunami runup heights at Samchuk and
Imwon port.
The 1983 tsunami is the first one suffering
heavy damage in the eastern coast of Korea since 17 century when
the 1741 Oshima-ohshima tsunami attacked the coast. The people become now aware
of the risk of tsunamis, which is, however, not evaluated scientifically. In
the beginning of the risk evaluation, the process of the damage in Korea should
be carefully studied. Imwon is the best place for tsunami research, because the
most heavy damage was reported and detailed field observation was done by
NIDP(1999), so that the data is available to study the behavior of the tsunami
and discuss the damage. Figure 3(b) shows the geometry
and measured runup heights at Imwon port where the
tsunami runup heights
of 3.59 m nearby the road along the coast, 5.1
m at the middle of the town and 7.5 m at the upper along the river.
Figure 4 shows the runup heights and geometry along the line from the shallow
sea to the inland and the calculated runup heights. Because of low accuracy of
the land data in the simulation, we cannot compare the results inland, however
can the data near the shore. The good agreement between measured and calculated
heights along the shore is shown in Figure 4, indicating that the tsunami in
the sea region is well reproduced by our model. The further analysis with the
proper geometry and land-use on the land is required.
(a) Measured runup
heights
(b) Calculated heights
Figure 4. Schematic
explanations of tsunami measured and calculated heights at Imwon port.
References
1. 相田 勇 (1977) 三陸沖の古い津波のシミュレーション,
地震研究所彙報, Vol.
52, pp. 71-101.
2. Aida, I. (1984), A source models of the
1983 Nihonkai-earthquake tsunami, Proceeding of 3rd UJNR(United States-Japan Cooperative Program in Natural Resources) Tsunami Workshop, pp. 57-76.
3. NIDP (1999), Study on tsunami hazards mitigations along
the Korean eastern coast(I), Report of NIDP (National Institute for
Disaster Prevention), 192 pp.