![]()
![]()
![]()
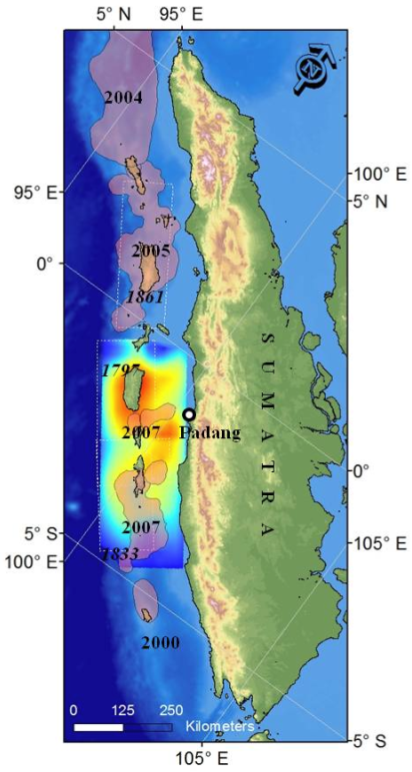
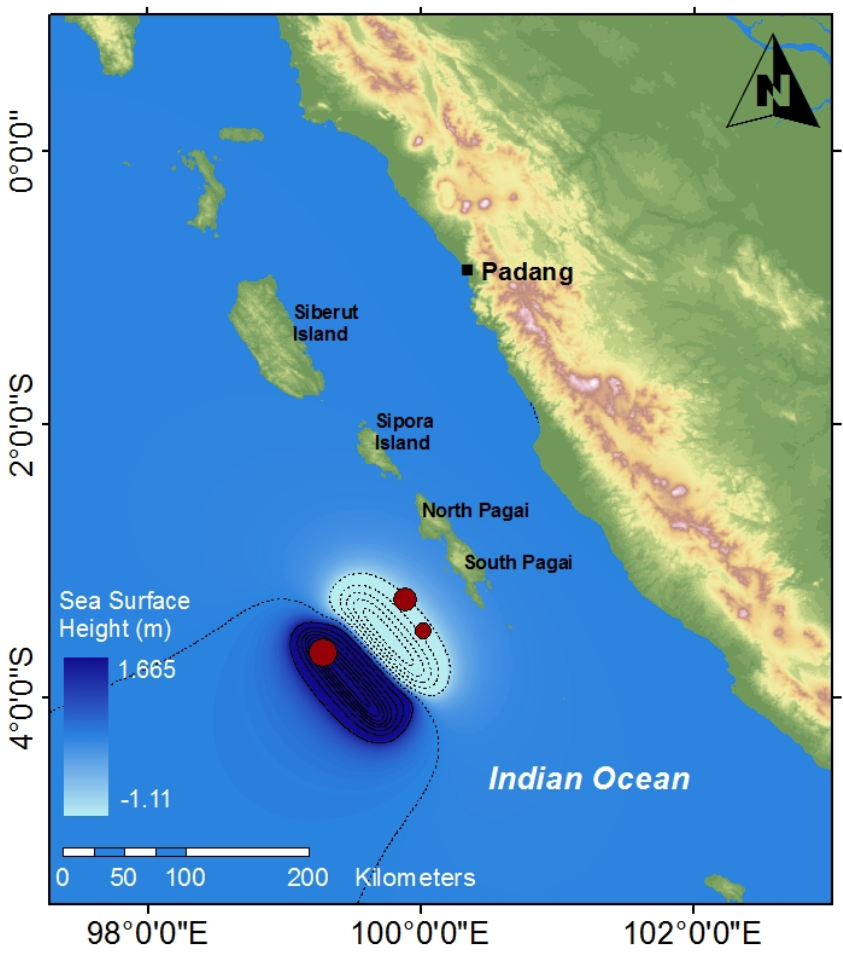
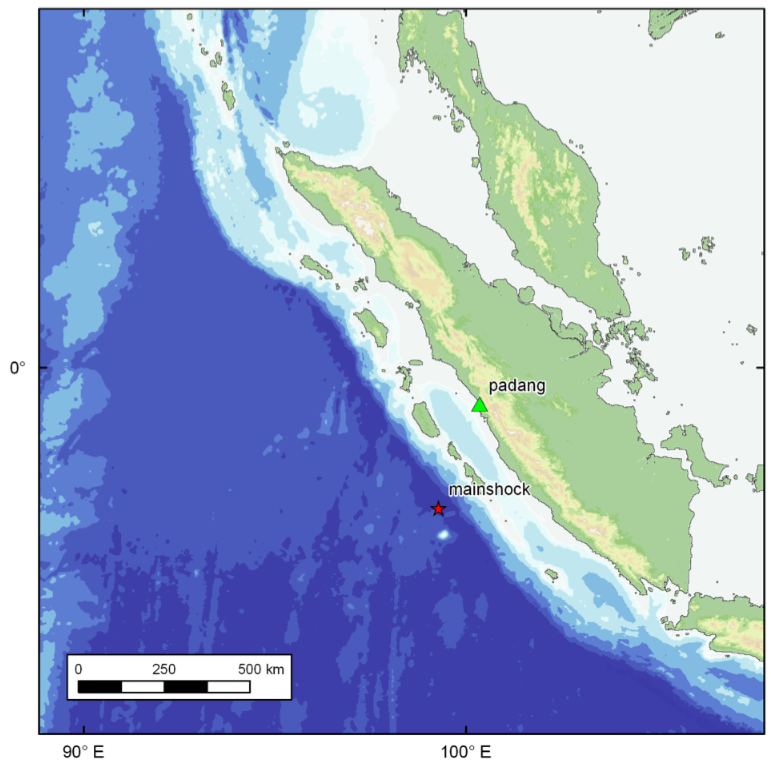
Historical Earthquake and tsunami in the west coast of Sumatra. White dotted lines are the historical faults, indicated by year in italics (Natawidjaja et al., 2006); transparent rupture zones are the result of recent seismic activity, indicated by year in bold (Sieh et al., 2008), and the seismic gap indicated by the yellow to red area (Natawidjaja, 2009)
![]()
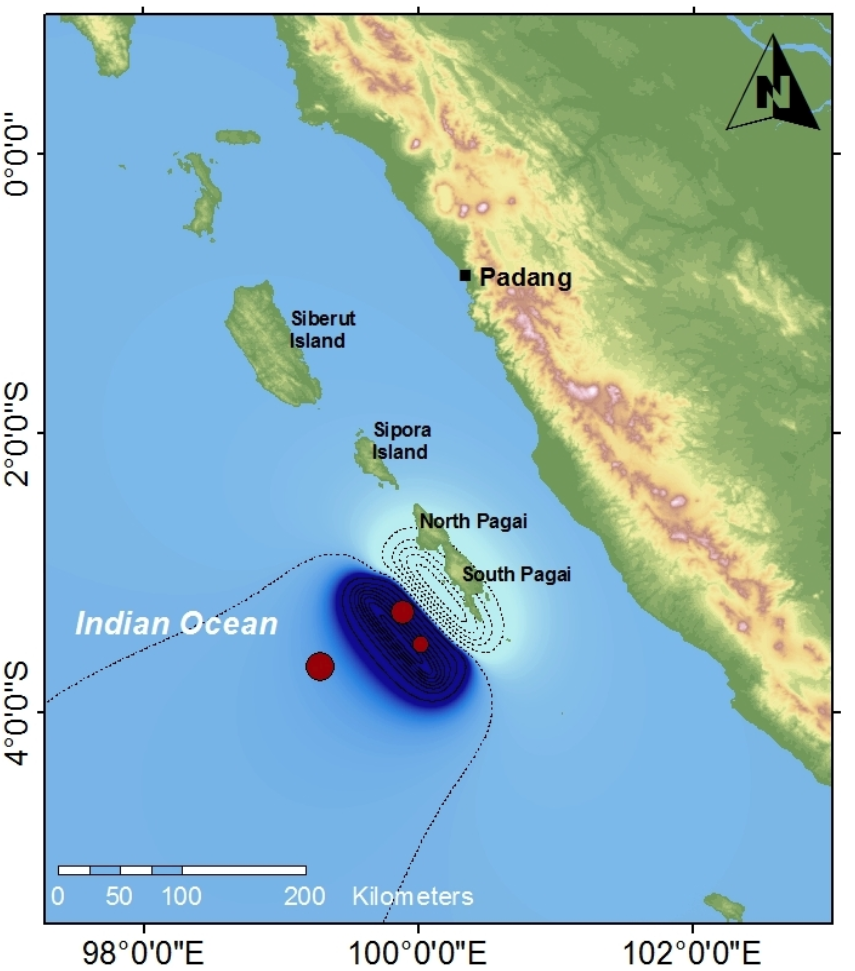
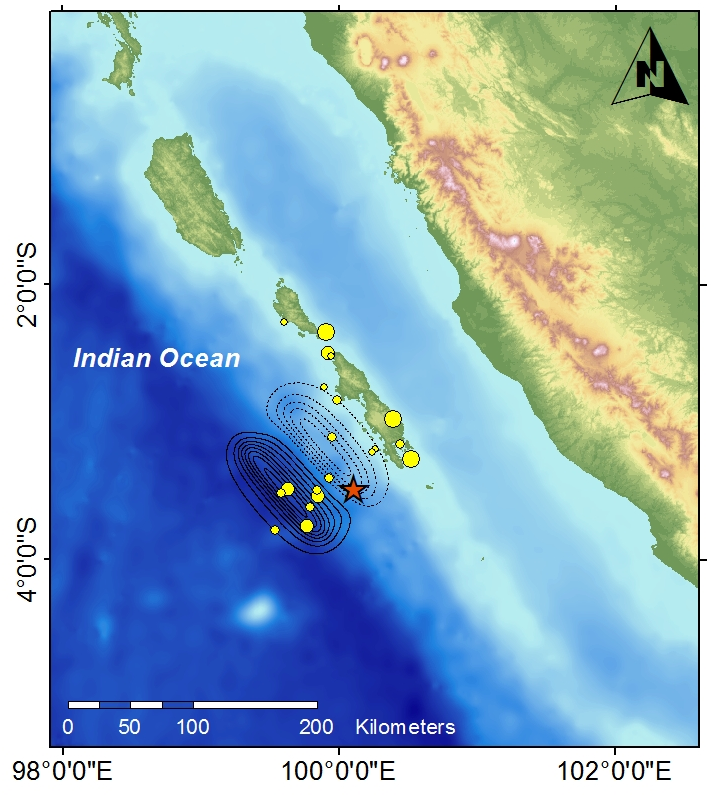
The differences among cases are the location of the fault origin.
![]()
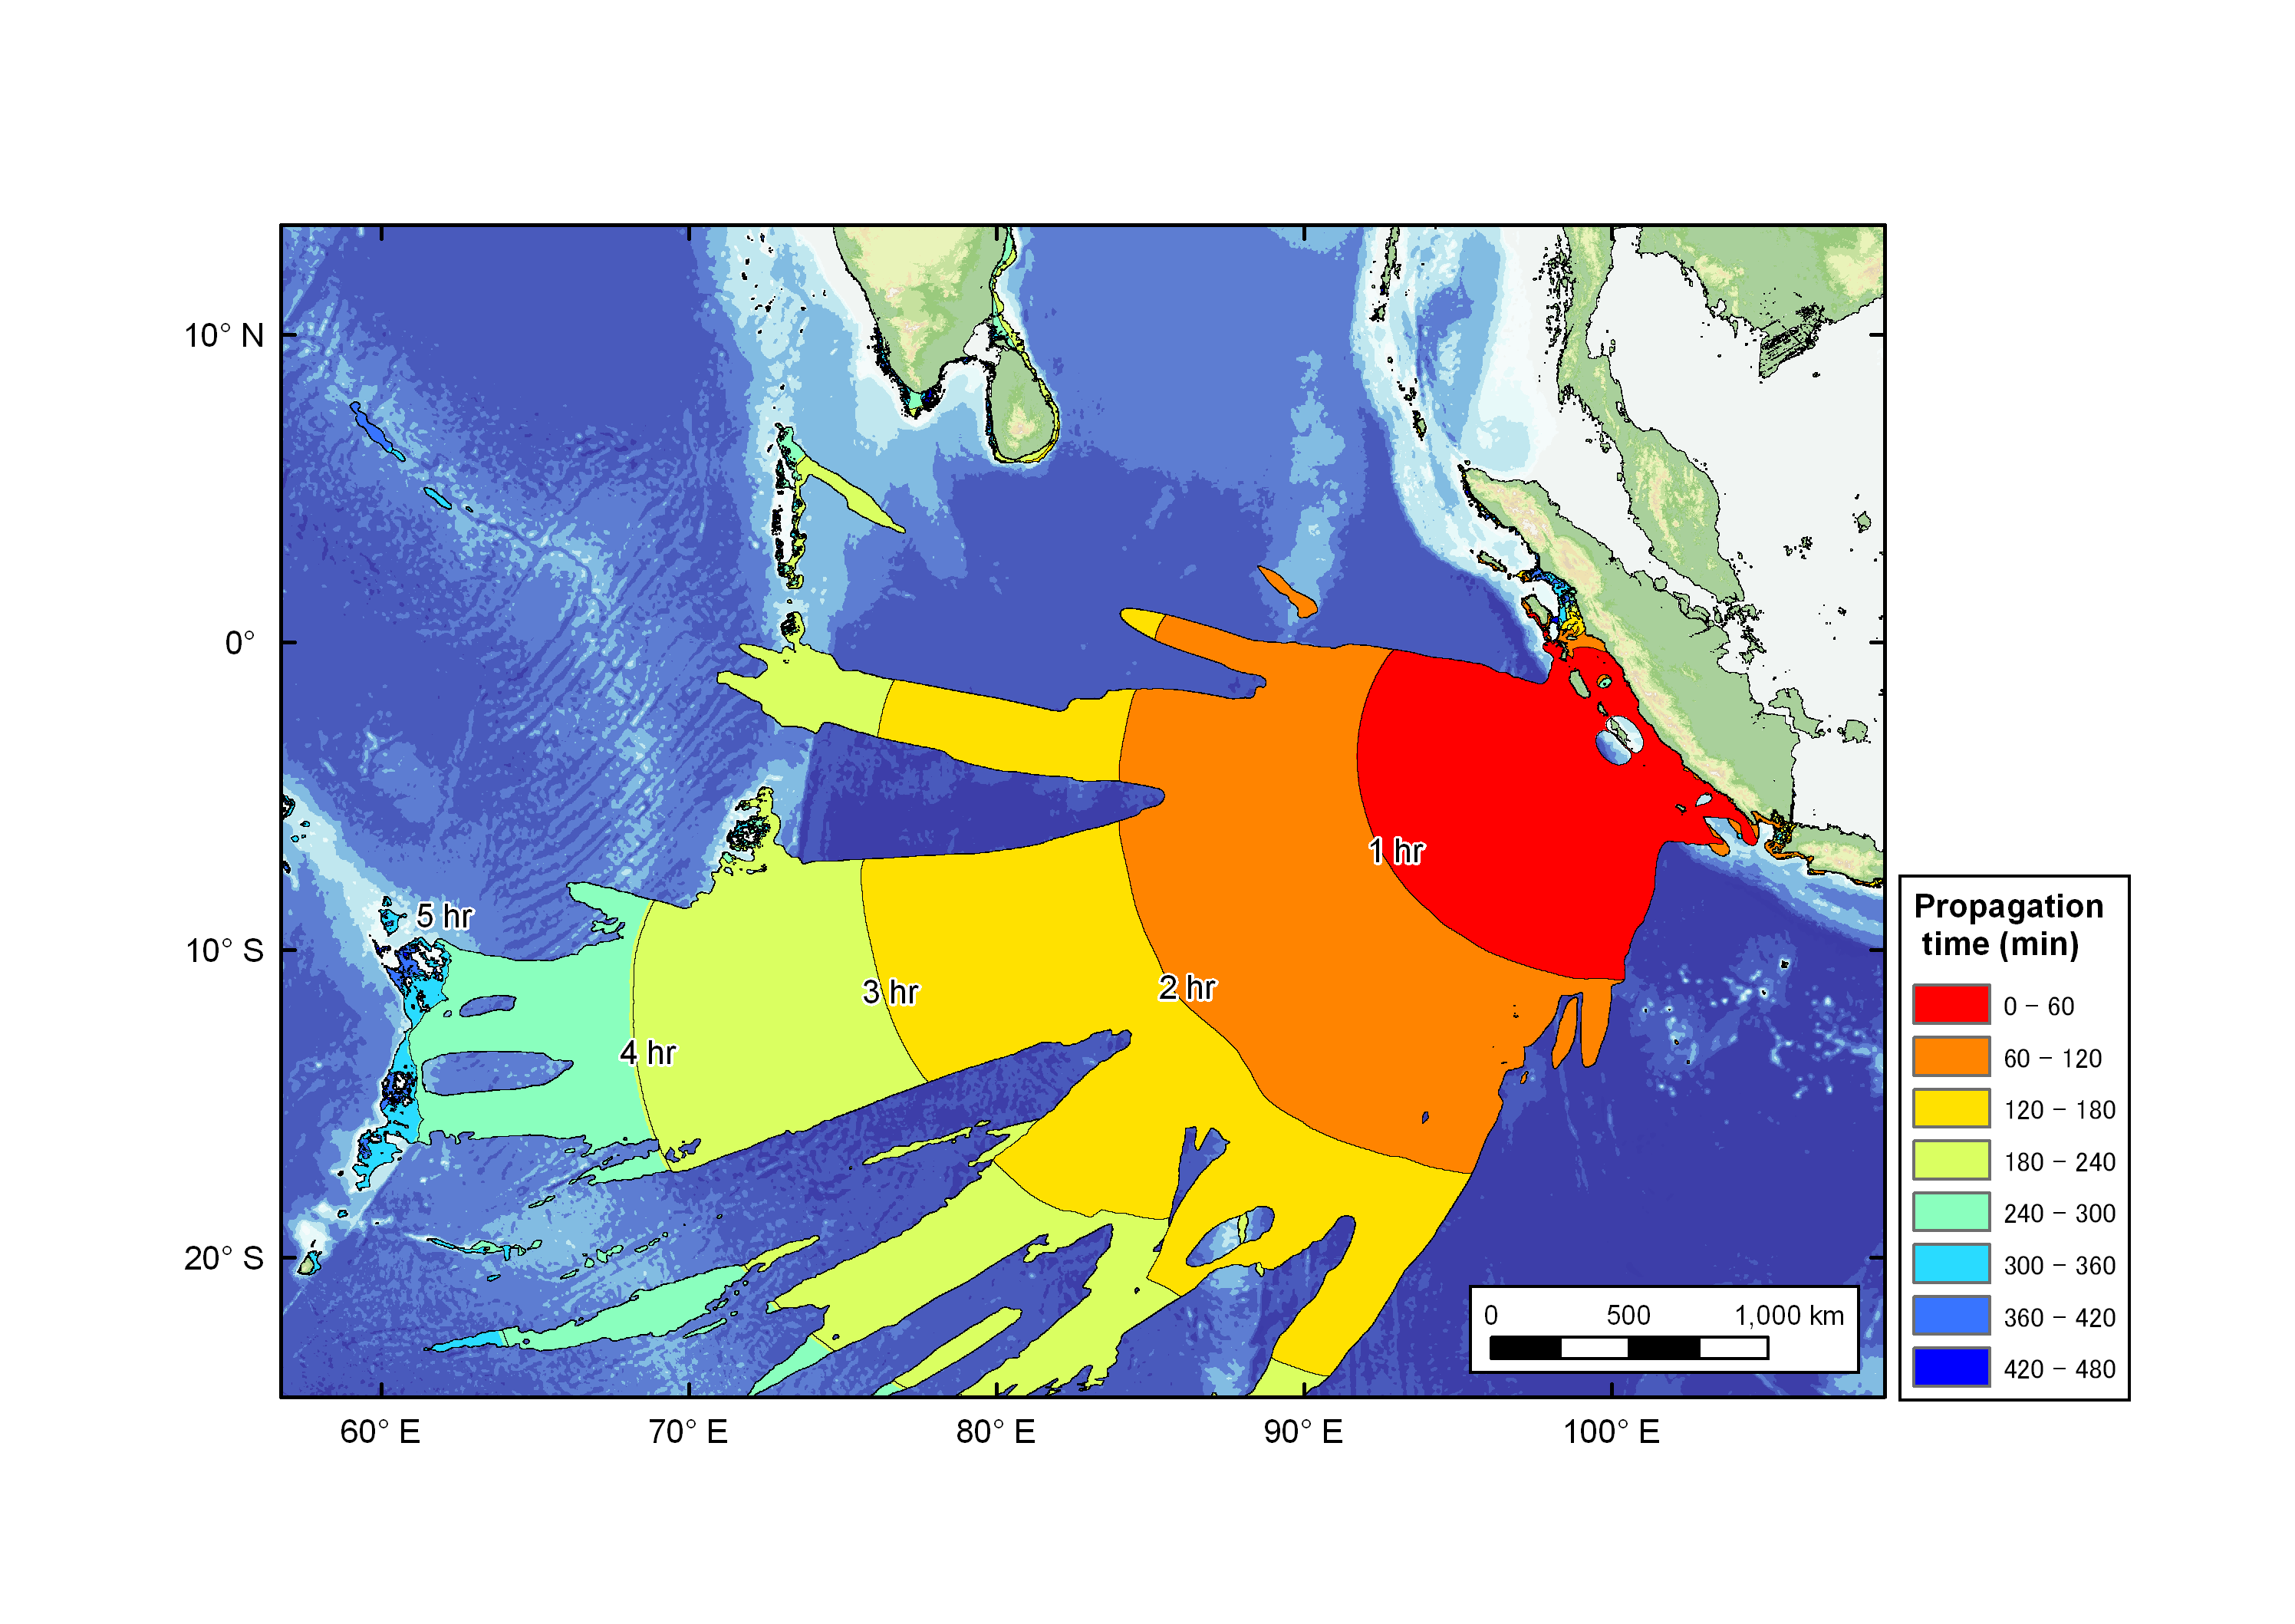
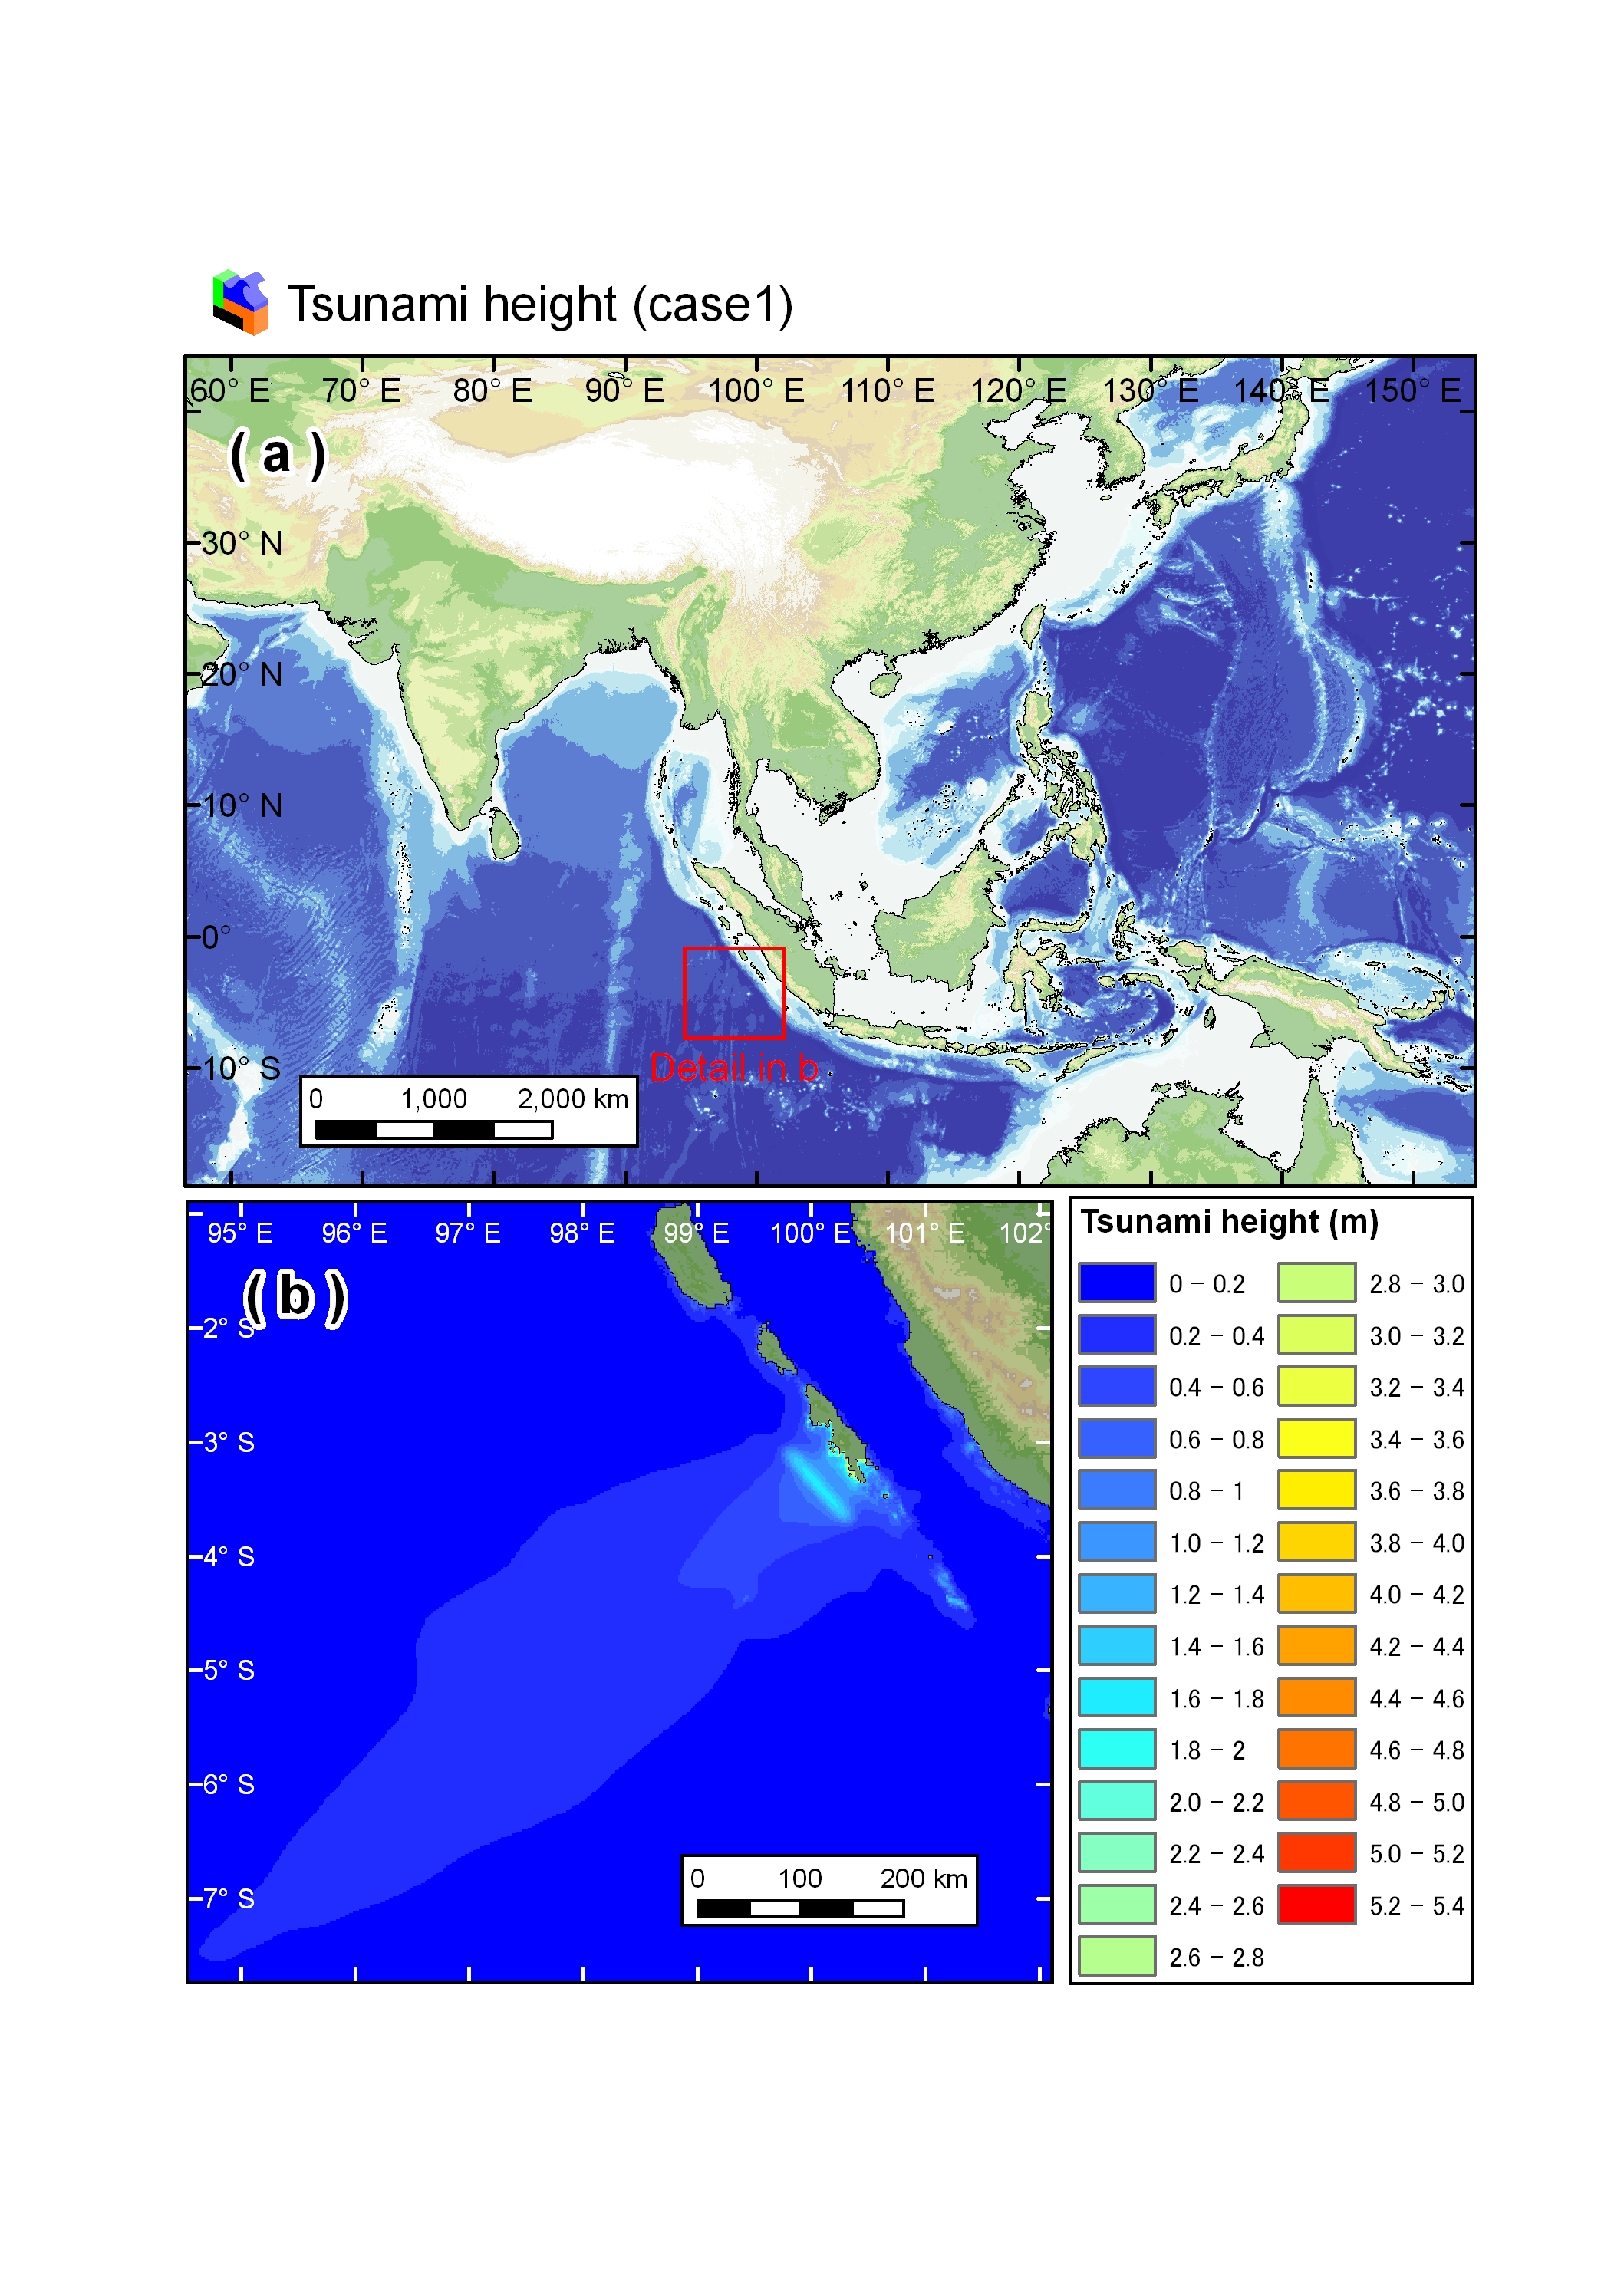
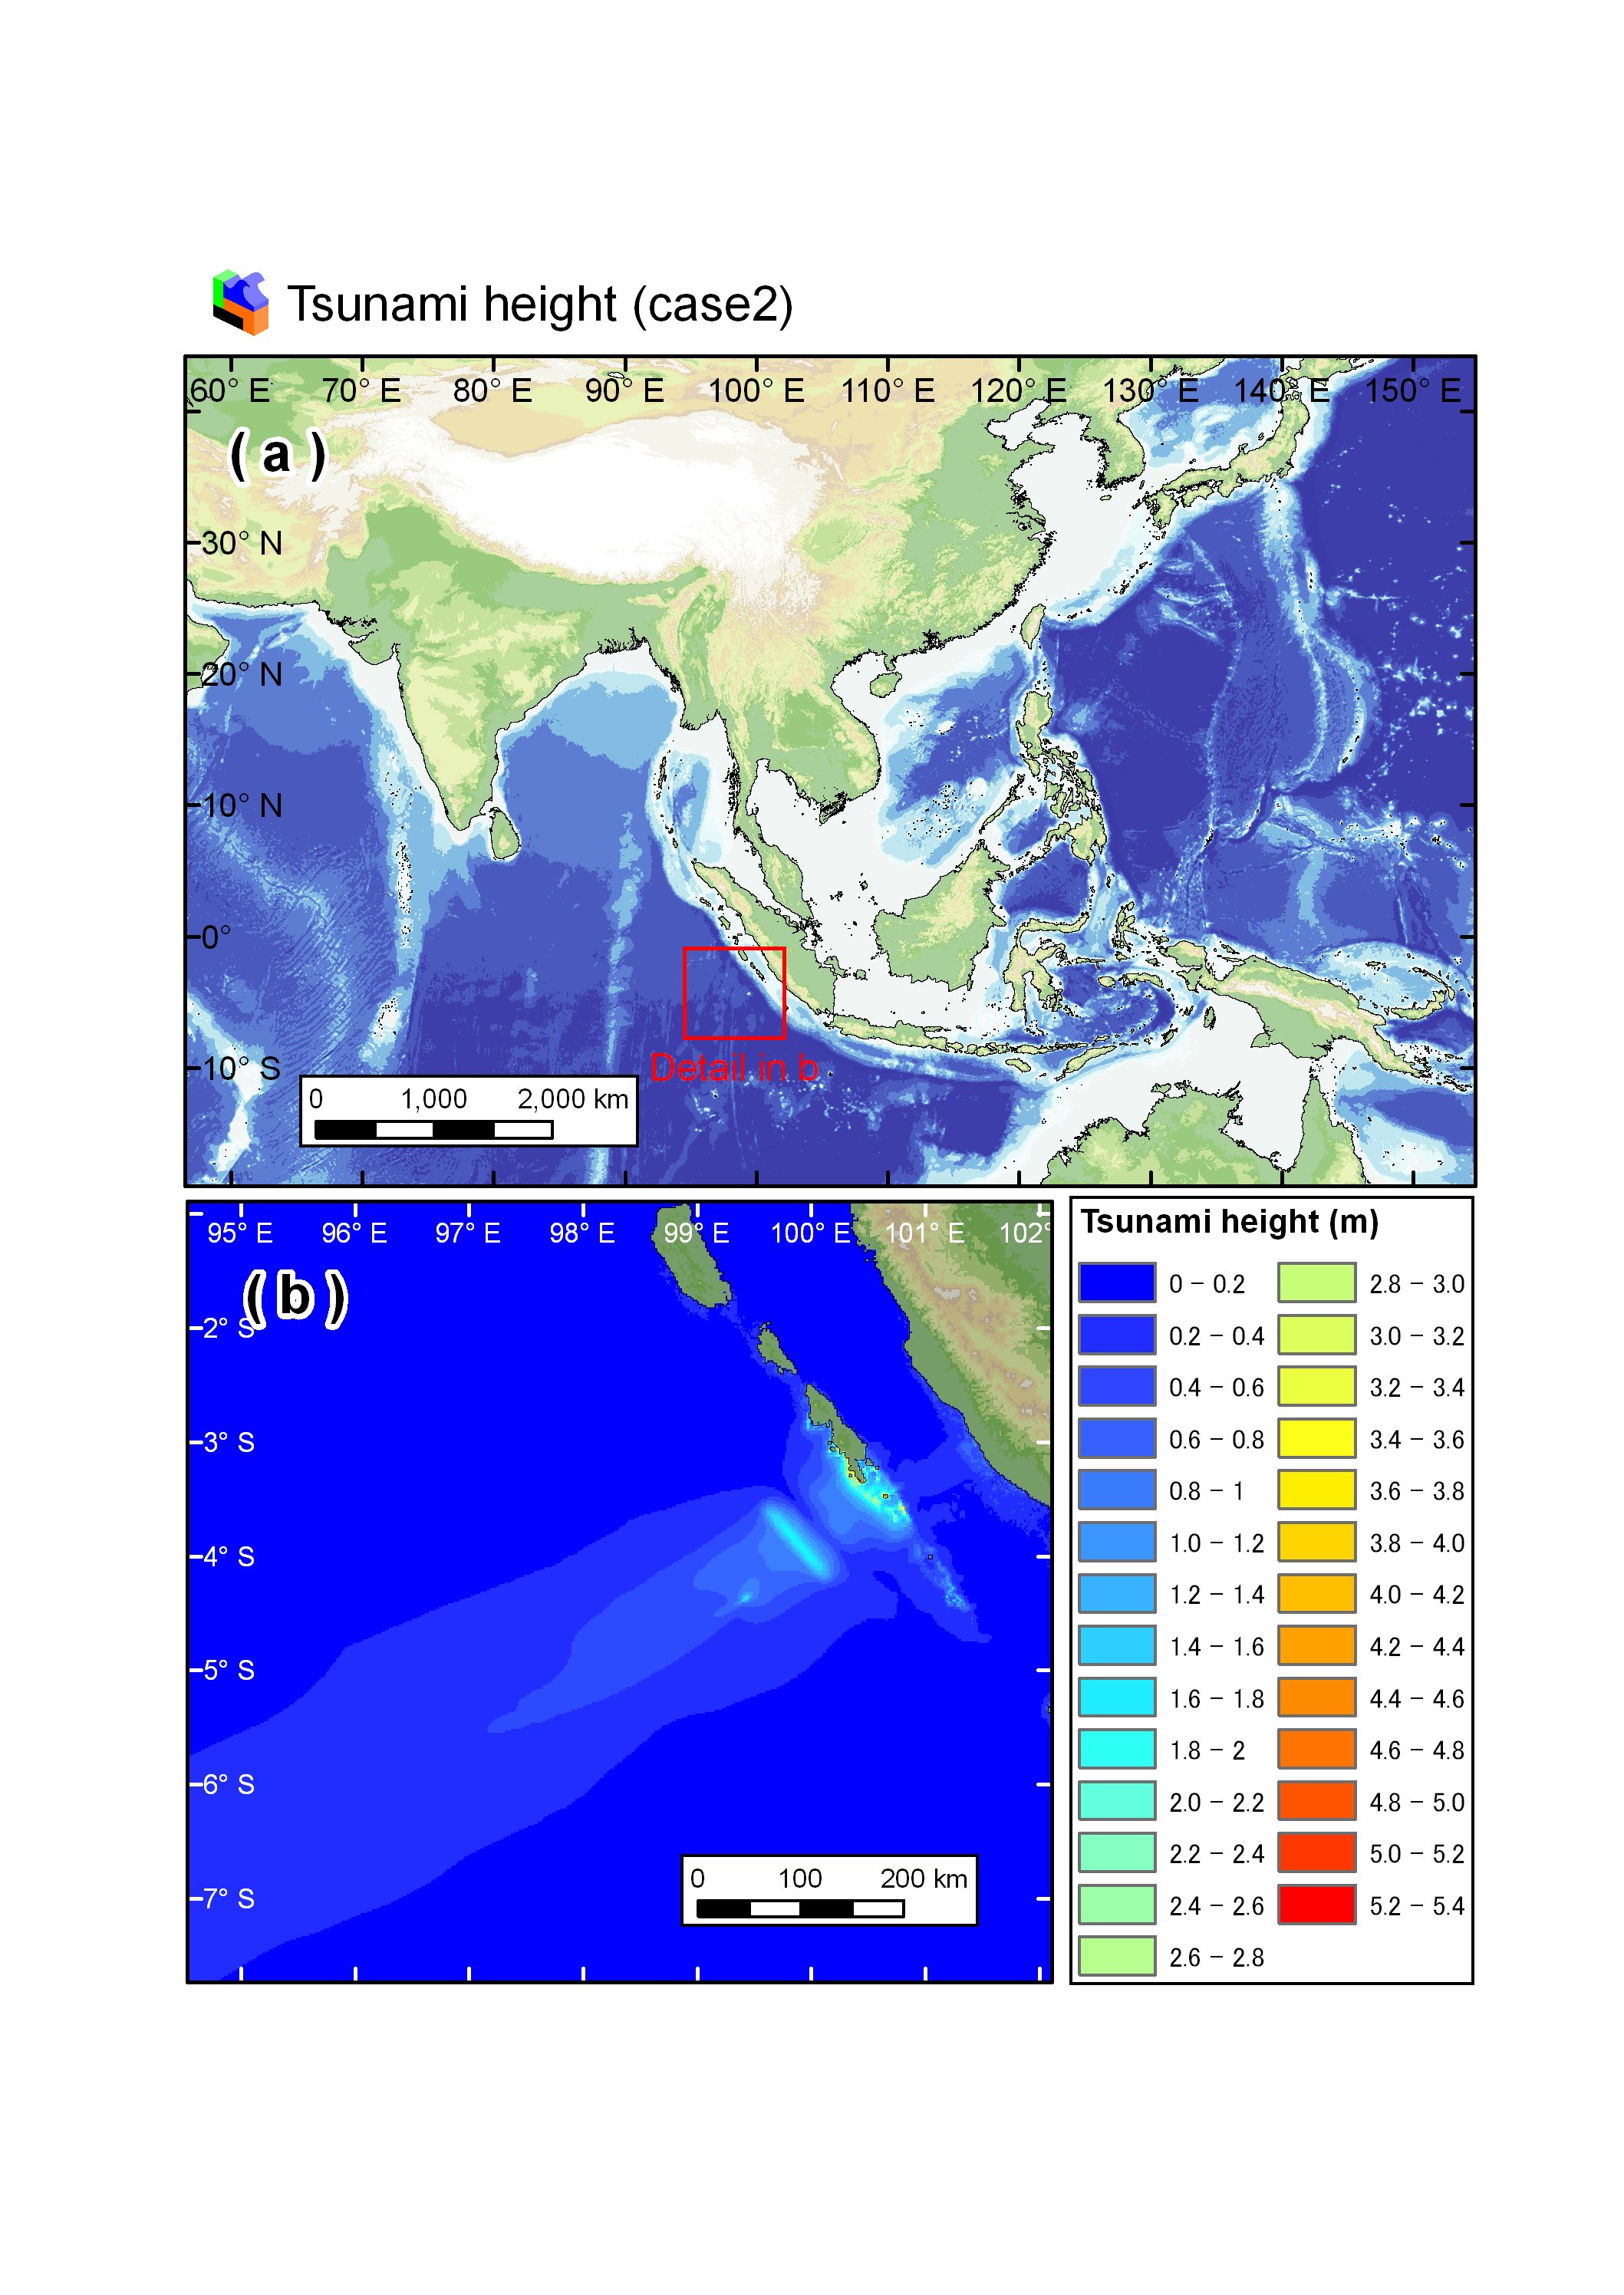
For original resolution, click the image below.
![]()
![]()
![]()
![]()
![]()
![]()
![]()
![]()
![]()
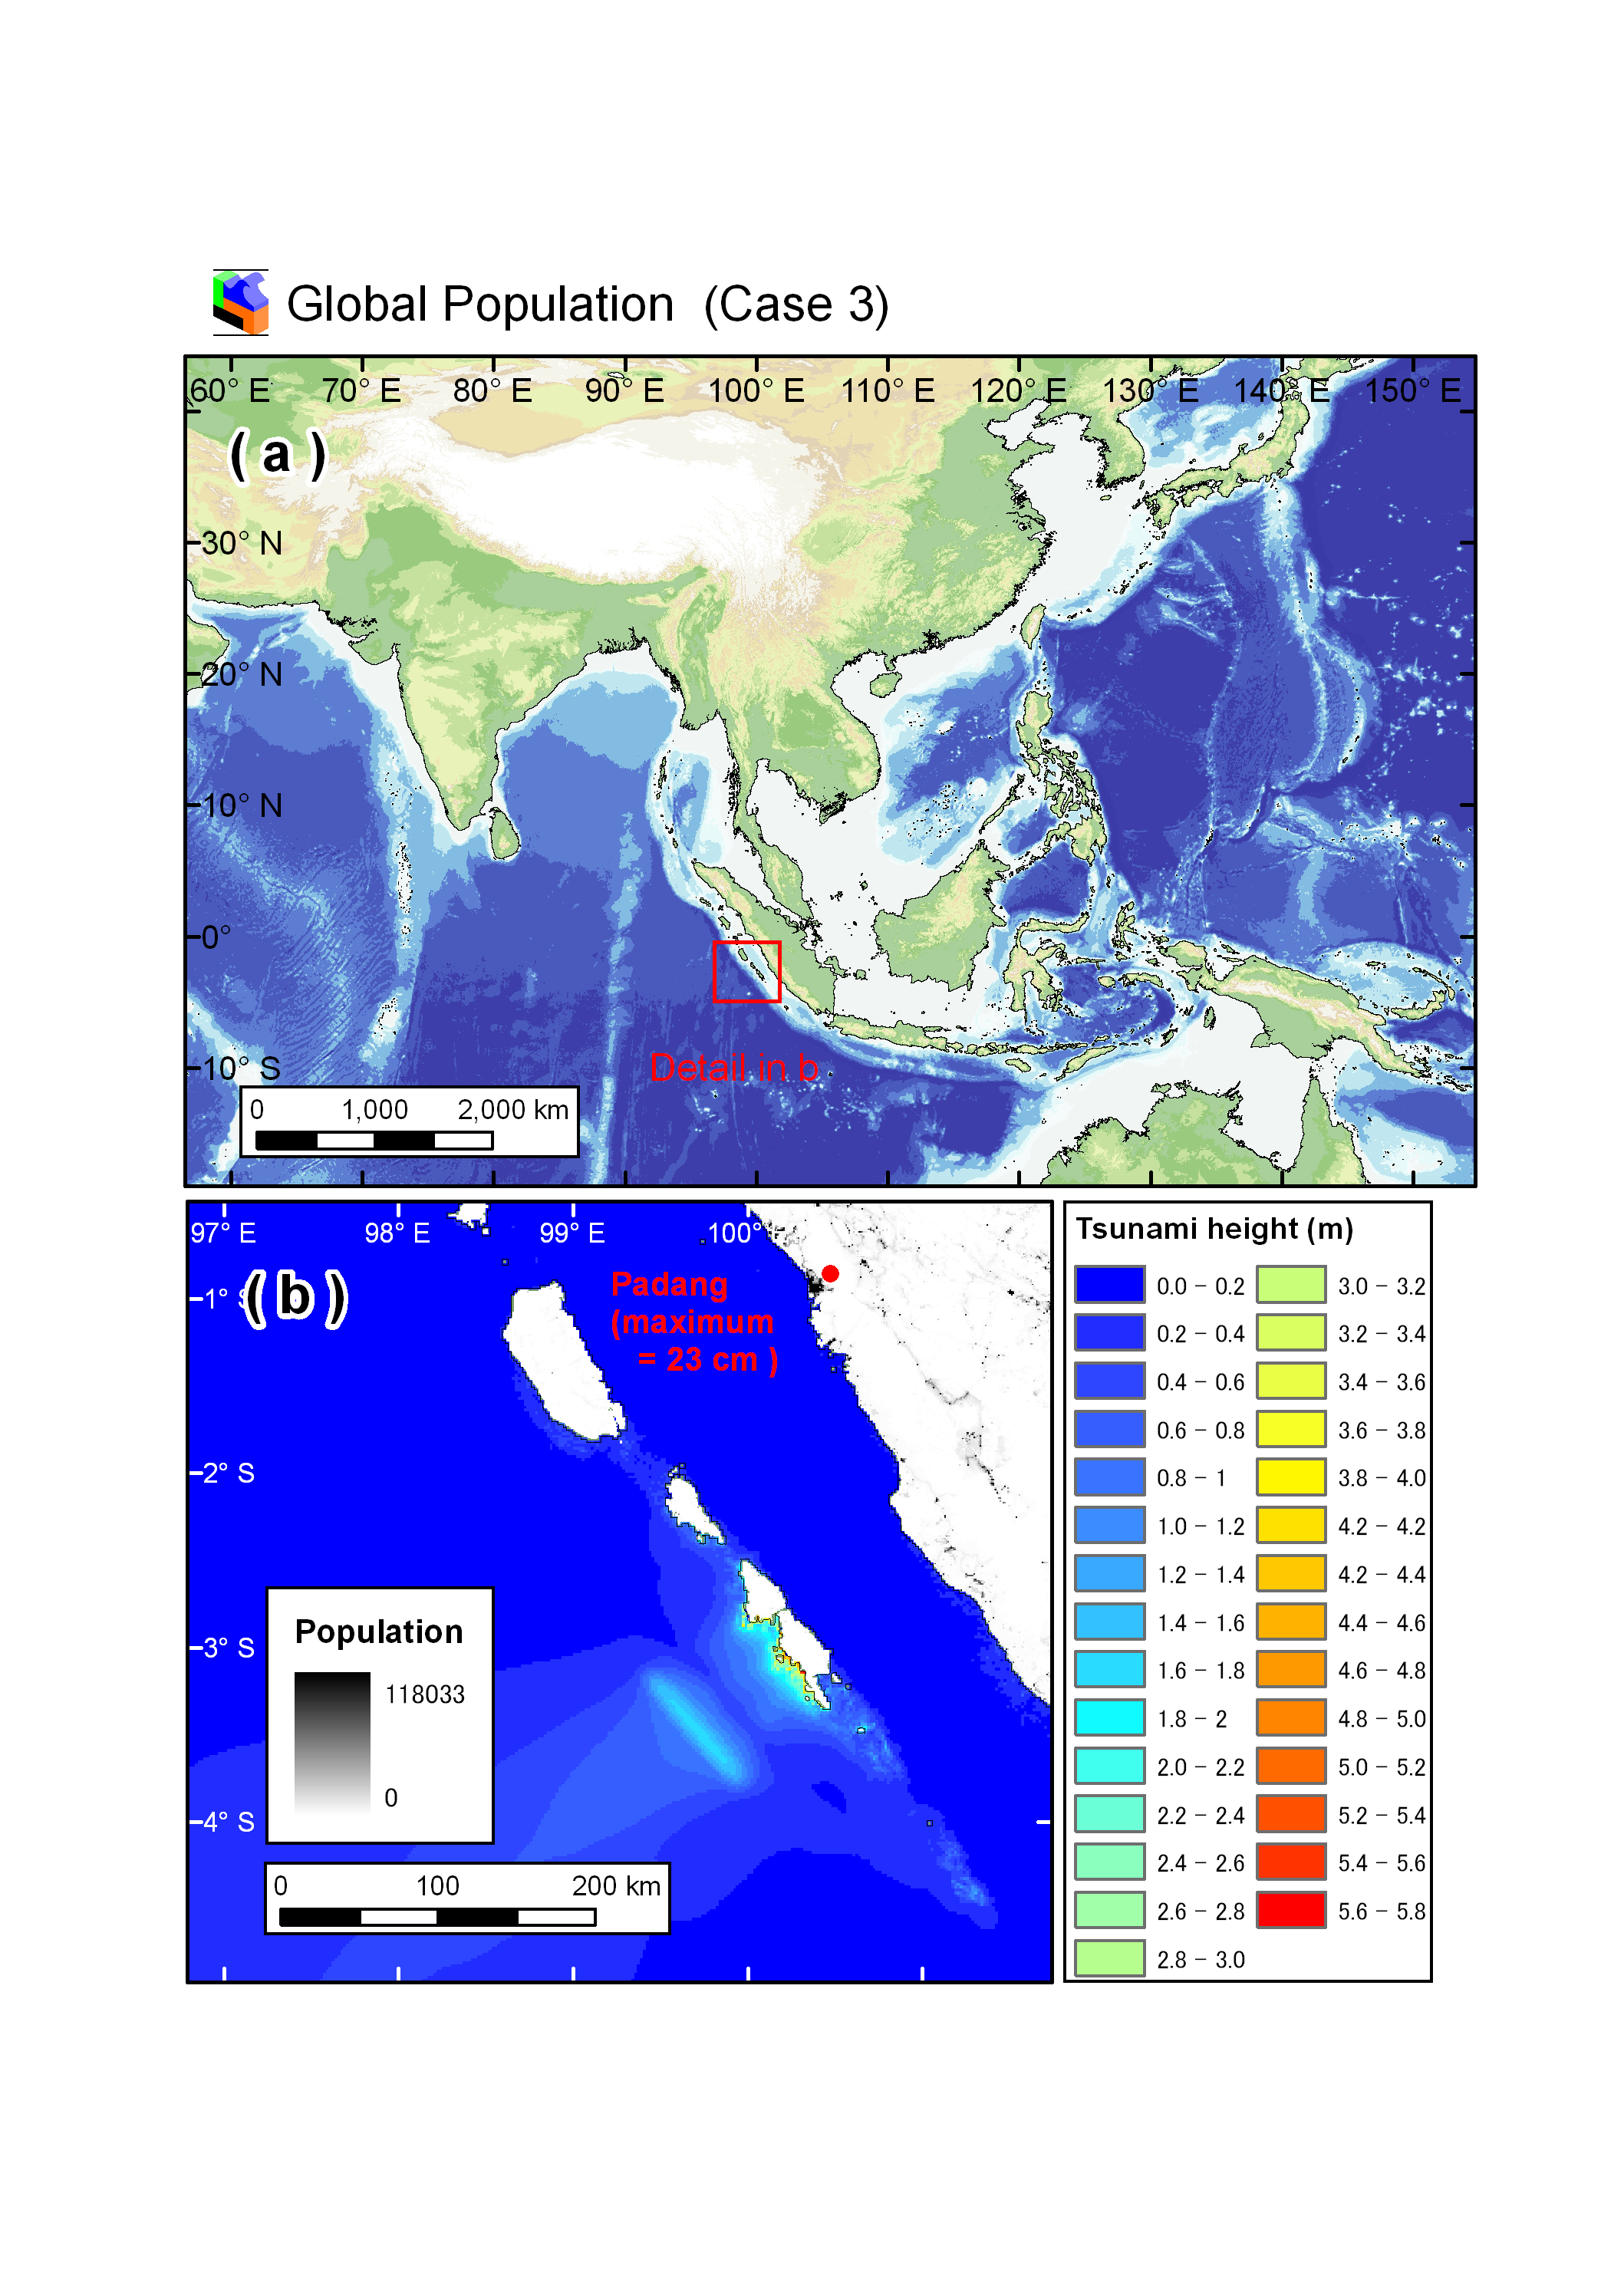
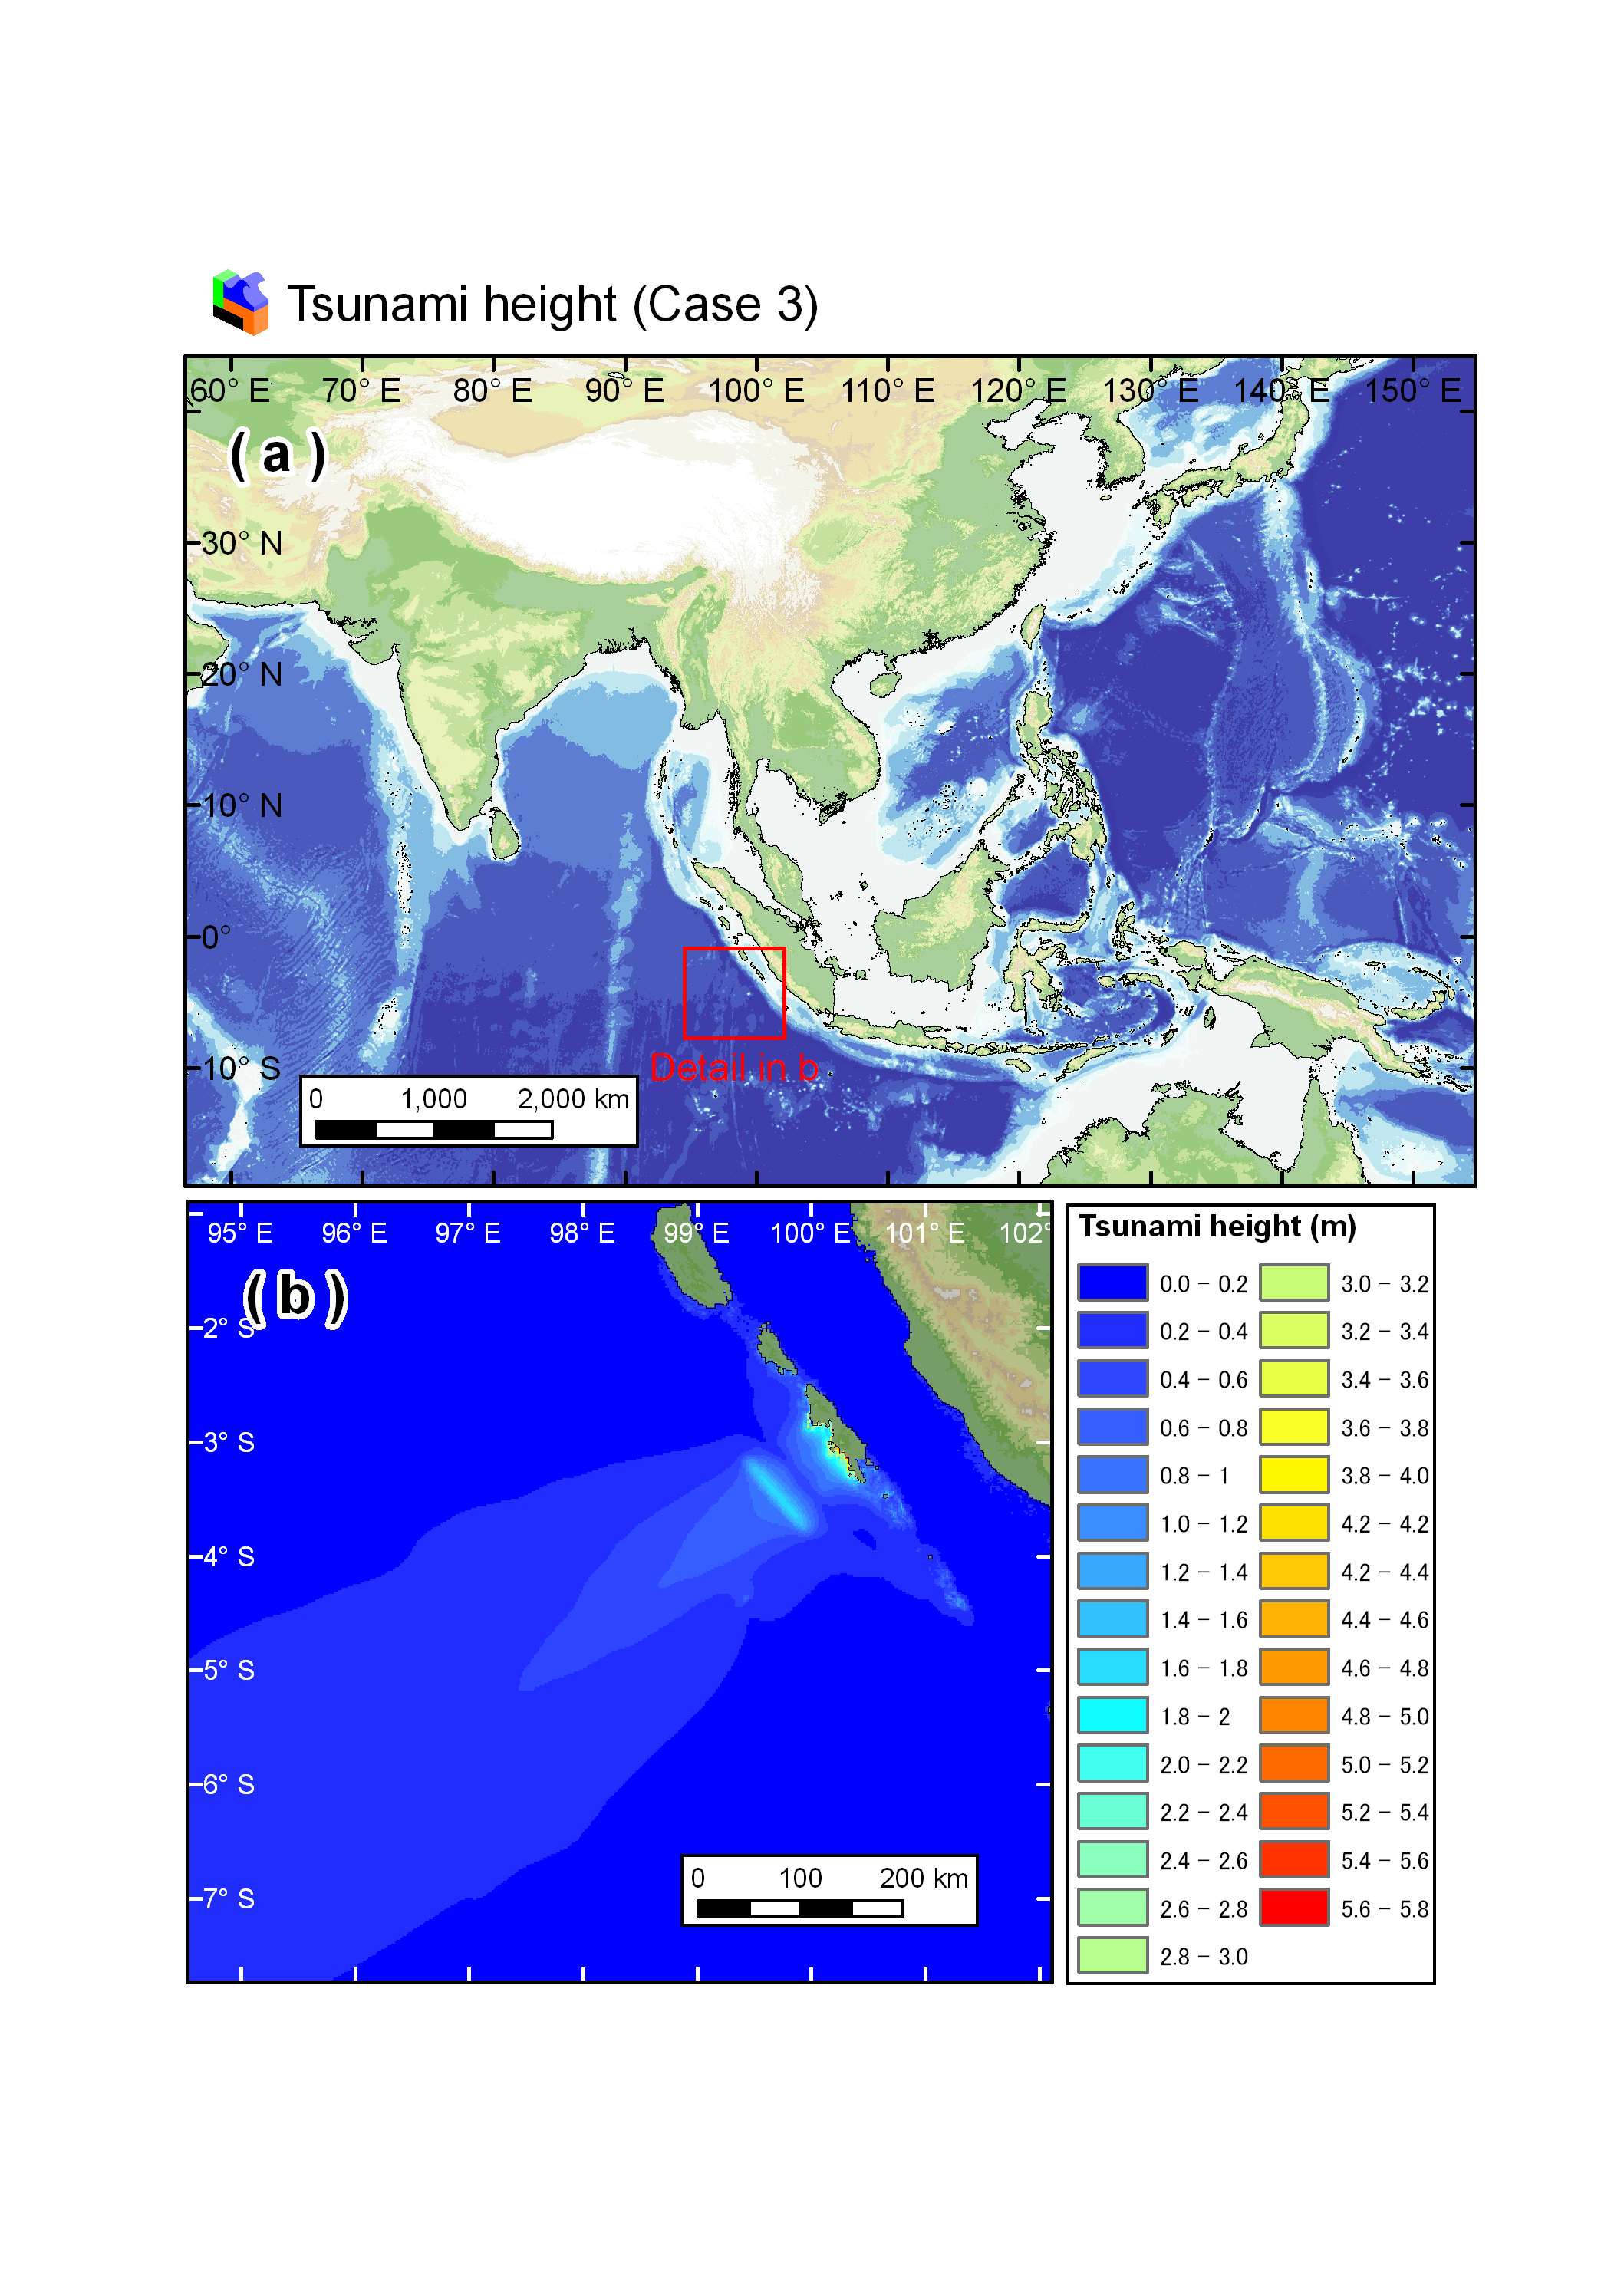
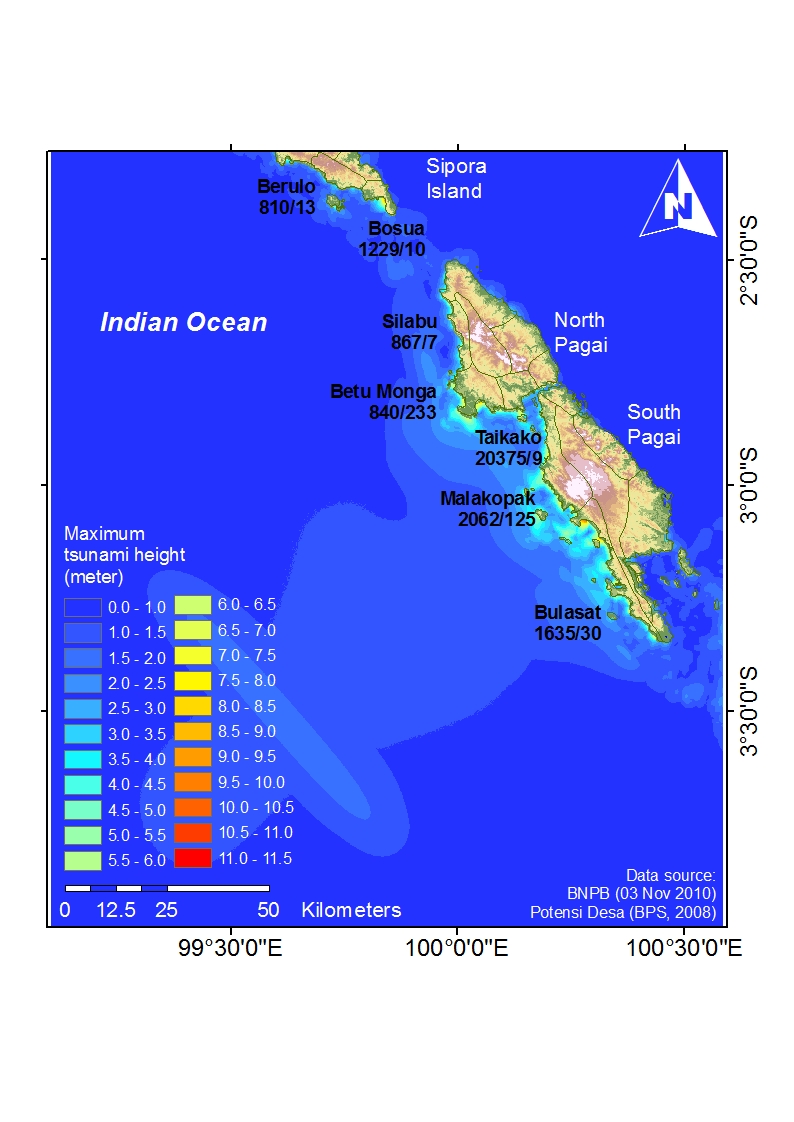
The maximum wave height is calculated using a 90m grid size, based on SRTM data for topography. The model using a fully non-linear shallow water equation solved by a finite difference scheme in TUNAMI-N2. The black bold text showing the name of village, total population and number of casualties on each village. The maximum wave height distribution is shown by the color blue to red.
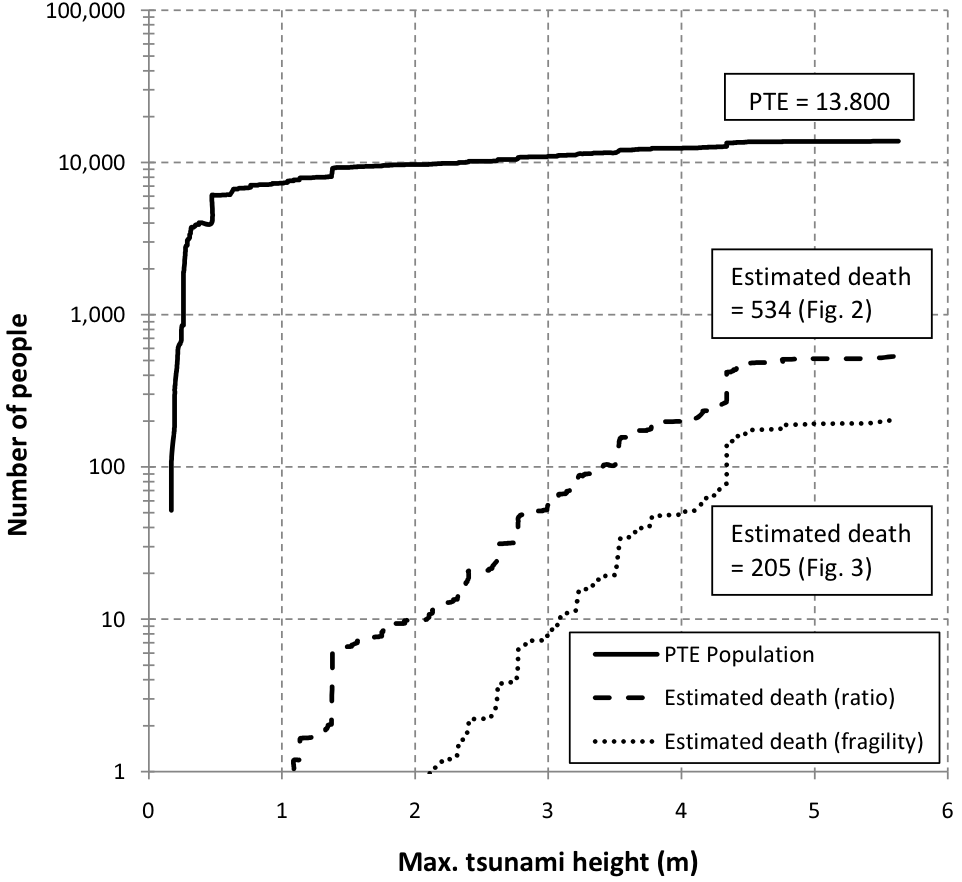
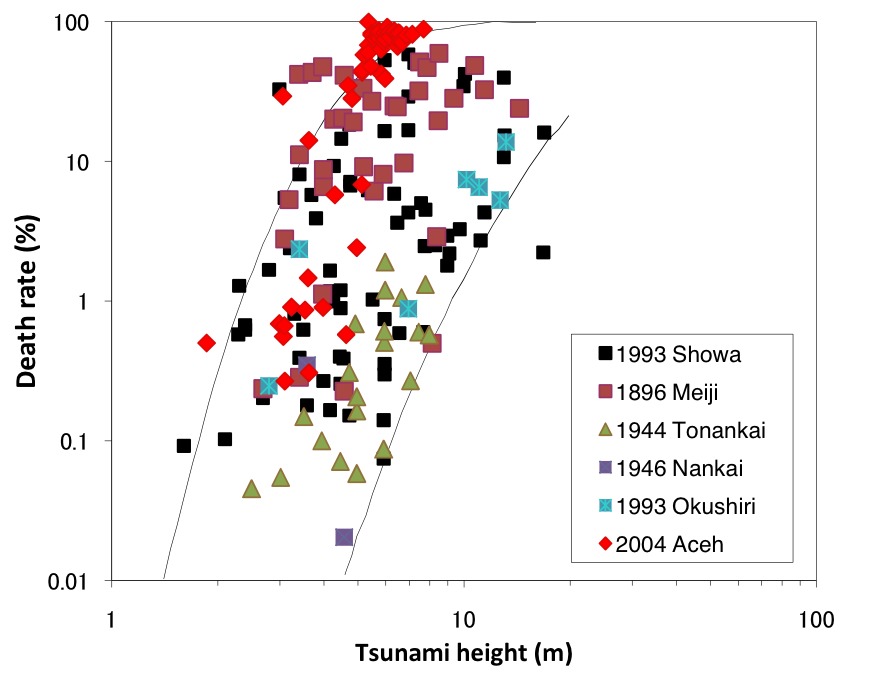
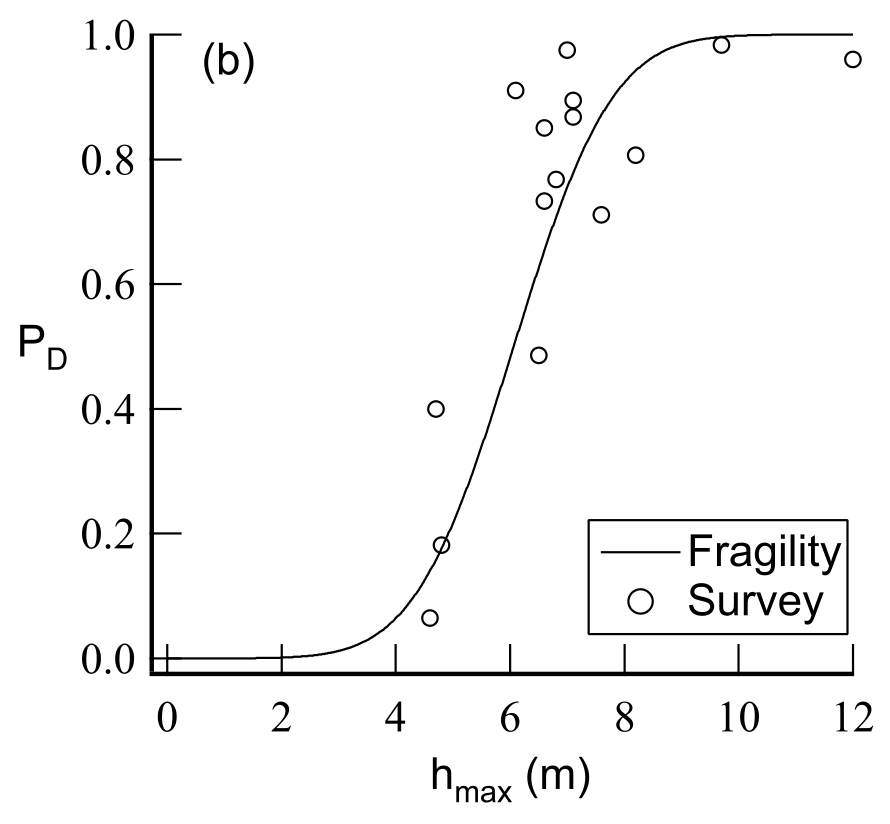
Number of population at risk along the coastal grid (30 sec or 928 m) was estimated over the simulated maximum tsunami height in order to evaluate a number of potential tsunami exposure (PTE), as exposed population. Results are shown in the Figure 1 below. In brief, there were about 14,000 people at risk of the maximum tsunami height of almost 6 m. Number of death can be estimated by two proposed functions. Tsunami death ratio was first proposed by Kawata (1997) using data from fives historical tsunami events in Japan. Data in Banda Aceh, Indonesia was then added by Koshimura et al. (2009) as shown in Figure 2 (Red dot). Using the curve of Banda Aceh (upper regression curve), number of death is estimated at 534. Moreover, number of death can also be estimated using the proposed fragility curve (Koshimura et al., 2009) as shown in Figure 3. Applying Figure 3, 205 deaths is estimated. Main different of these two curves is that, for example, the death ratio is about 1 % at 1 m tsunami height in Figure 2 where the death ratio starts if tsunami height larger than 4 m in Figure 3.
Fragility curve for fatality (Koshimura et al., 2009)
1. Kawata Y. [1997] “Prediction of loss of human lives due to catastrophic earthquake disaster,” Japan society for natural disaster science, 16(1), 3–13. (In Japanese)
2. Koshimura, S., Namegaya, Y. and Yanagisawa, H.: Tsunami Fragility - A new measure to assess tsunami damage, Journal of Disaster Research, 4, 479−488, 2009
![]()
For original figure (.png), click the image below.
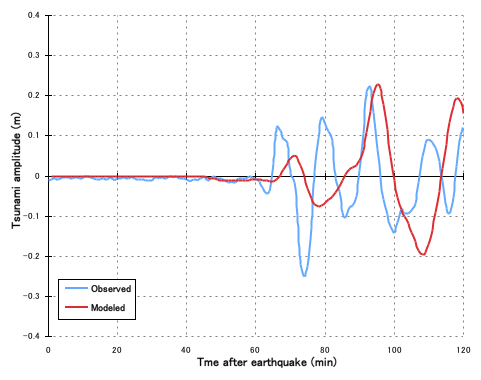
Waveforms at Padang station (Case 2)
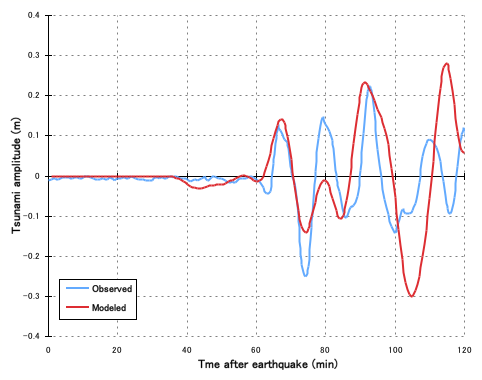
Waveforms at Padang station (Case 3)
Click to play(1.8MB)
Click to play(26.37MB)
Click to play(17.75MB)
Click to play(28.02MB)